Home About Contact Dashboard Reports

Building a forum on public policy in central Wisconsin

Become a Partner

Enrollment in the University of Wisconsin System

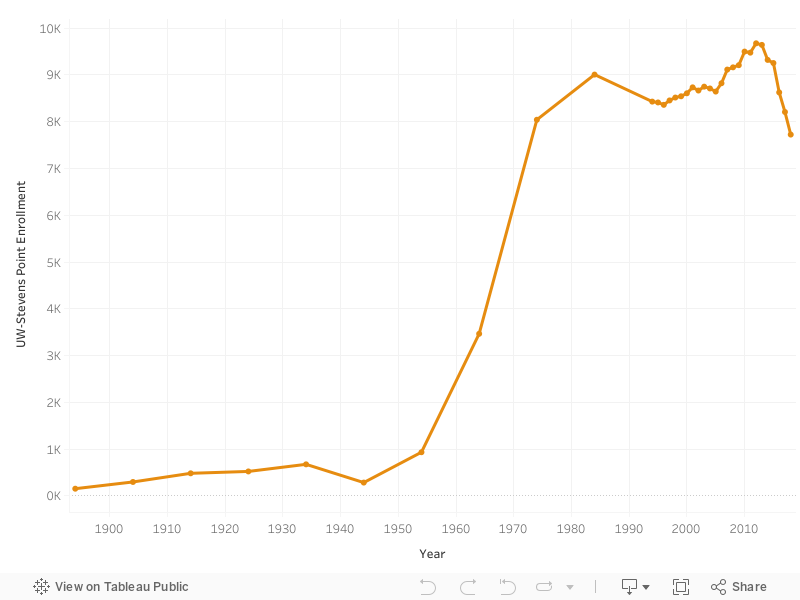
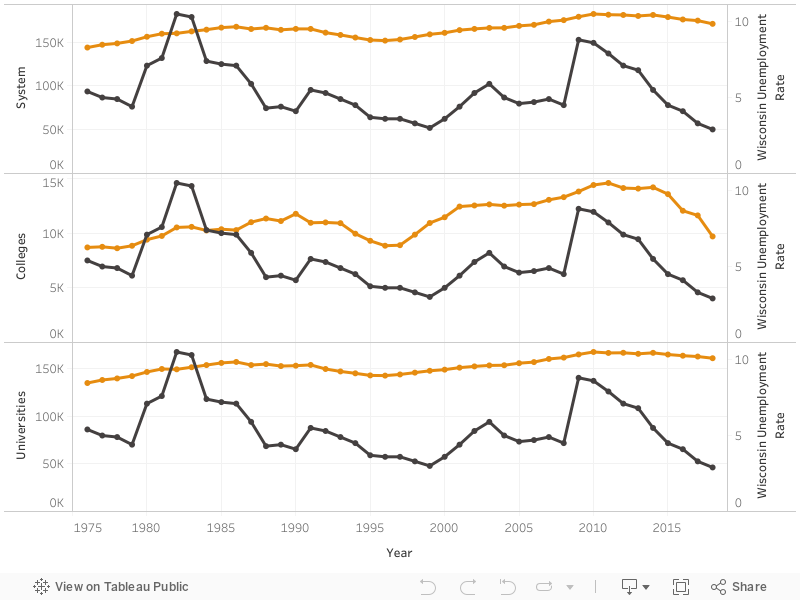
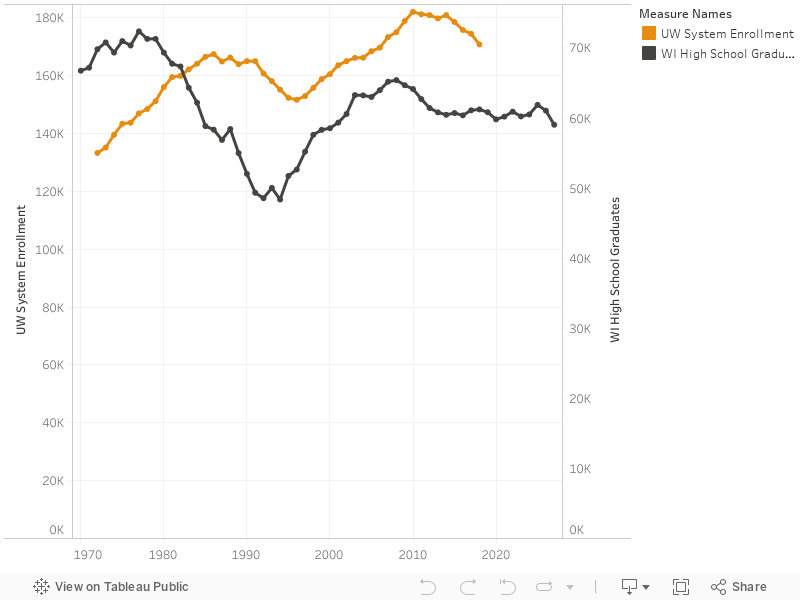
First, several preliminary notes on the various data and sources. The 2010-2017 enrollment data, the 2018 preliminary enrollment data, as well as the 1972-2016 enrollment data are from UW System. The UW-Colleges online datum in 2018 is the sum of the Online Allocation among the Universities post-merger. The UW-Stevens Point historical enrollment data are from their Office of Institutional Research and Effectiveness. These data are available by decade from 1894-1994, and then annually from 1994-2013. The June unemployment rates in Wisconsin are from the Federal Reserve Economic Data where the number of WI high school graduates data, 1970-2027 are from the National Center for Education Statistics. Last, the graduates data are projected from 2016-2027.

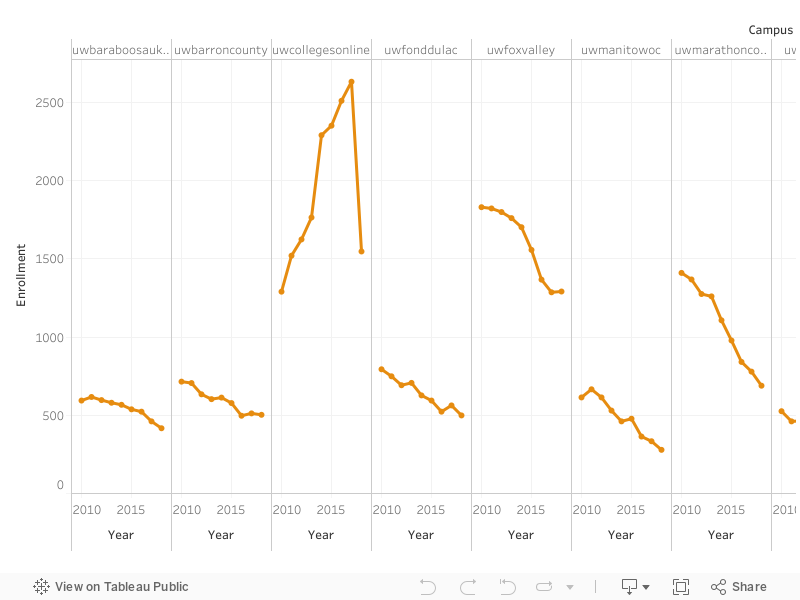
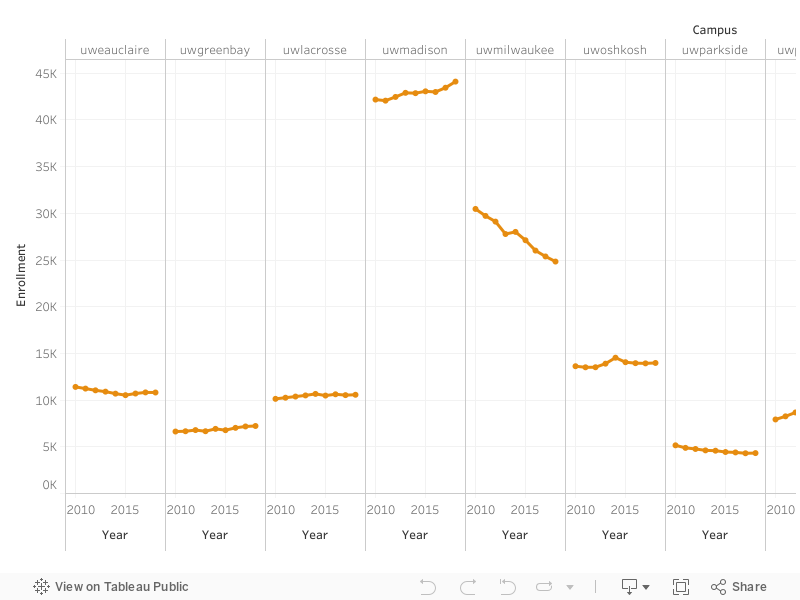
Enrollment in the University of Wisconsin System, 2010-2018

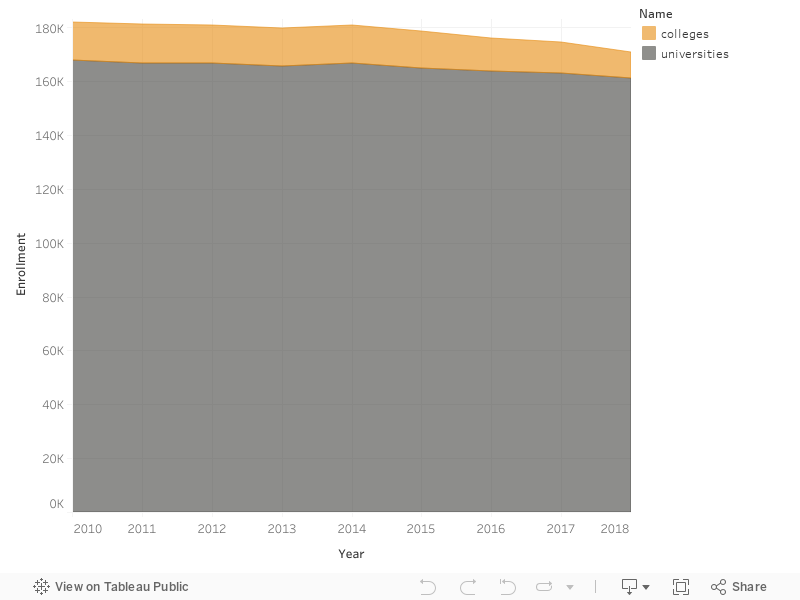
The figure above plots UW System enrollment in the fall of each calendar year. Each bar breaks UW System total enrollment in each respective year into either enrollment in the Colleges or the Universities. Enrollment in the UW-Colleges makes up between 6-8% of total UW System enrollment from 2010-2018. Prior to the merger of UW Colleges with the Universities, UW System enrollment fell by 7,574 students from 2010-2017; that is a 4% reduction in total enrollment. While enrollment at the UW Colleges was down by 2,777 students during the period, a 19% reduction, the colleges accounted for only 37 % of the total decline in the system. During the same period, enrollment in the Universities declined by only 3% for a total of 4,797 students; that accounts for 63% of the decline in UW System total enrollment. The difference between the percent of the decline attributed to Colleges and Universities after the merger diminishes significantly to 58-42 split.

Enrollment in the Colleges, 2010-2018

The figure above plots enrollment by UW College and illustrates short-run trends by College. Notice that except for enrollment in UW-Colleges Online, enrollment in all UW Colleges is down over the period from 2010-2018. From 2010 to 2017, enrollment declined by between 22-46% at each of the physical UW Colleges. During the same period. the greatest reductions in enrollment in levels occurred at UW-Marathon (631 students), UW-Fox Valley (544 students), and UW Waukesha (500 students), but the greatest enrollment reductions in percentages occurred at UW-Manitowoc (46%), UW-Marinette (45%), and UW-Marathon (45%).

Enrollment in the Universities, 2010-2018

The figure above plots enrollment by 4 year comprehensive. Notice above UW-Milwaukee accounts for 67% of the total loss in system enrollment while UWSP accounts for another 17%. In contrast to the UW Colleges, only 6 out of 13 Universities experience enrollment declines. From 2010 to 2017, enrollment grew by as much as 8% at UW-Green Bay (542 students), UW-Platteville (630 students), and UW-Whitewater (873 students). During the same period, enrollment fell by as much as 17% at both UW-Milwaukee (5,089 students) and UW-Stevens Point (1,292 students).

Enrollment at the University of Wisconsin-Stevens Point, 1894-2018

The Great Recession ended in early 2010, so it is natural to question how enrollment looked from a longer-run perspective. The figure above plots the available enrollment data at UW-Stevens Point. There are at least several things that stand out. First, the reduction in enrollment that occurred in 1944 was likely attributable to the Second World War. Second, the period is then followed by rapid growth in enrollment peaking in 1984, likely a result of the Baby Boom that followed WWII. Third, there was a lull in enrollment during the 1990s followed by another period of growth likely attributable to the Millennial Generation. Finally, there is the current period of decline in enrollment starting in either 2012 or 2013 with rapid contractions in enrollment occurring after 2015.

Enrollment in UW System, Colleges, and Universities with the June Statewide Unemployment Rate, 1976-2018

The figure above plots the annual enrollment numbers and the June unemployment rates in WI. This figure allows the reader to visually evaluate the conversation around historically low unemployment rates driving, in part, the most recent period of declining enrollment. The correlation coefficient for the variables in the figure and over the period 1994-2018 is estimated to be 0.2561 for the UW System, 0.2277 for the UW Colleges, and 0.2556 for the Universities; that is, there are weak positive correlations between the statewide unemployment rate and enrollment in the UW System as well as UW Colleges and Universities. In other words, enrollment tends to increase during periods with high unemployment rates and decrease during periods of low unemployment. Note however, only the enrollment variables appear to be cointegrated in the sense that a spike in one enrollment count is associated with a simultaneous increase in enrollment everywhere else.

Enrollment to Unemployment Rate Correlation Coefficient by Campus, 1976-2018

The figure above plots the correlation coefficient for each University in the UW System. Unexpectedly, not all universities experience reductions in enrollment when economic times are good. Although most campuses exhibit either weak or moderate positive correlation coefficients, there are 4 campuses that have negative correlation coefficients. UW-Green Bay, UW-La Crosse, UW-Oshkosh, UW-Superior, and UW-Whitewater tend to experience periods of increased enrollment when unemployment rates are low. Moreover, UW-Superior exhibits a moderate negative correlation coefficient.

System Enrollment with the Number of High School Graduates, 1971-2028

The figure above plots UW System enrollment along with the number of new high school graduates in WI. The number of high school graduates peaked in 1977 whereas enrollment in the UW System peaked in 2010. Currently, enrollment in the UW exceeds the number of students enrolled in 2006 and remains above the enrollment numbers observed in the mid to late 1980s.

The May graduation data and the fall enrollment data have a correlation coefficient equal to -0.02; that is, there is a very weak negative relationship between the variables. Unexpectedly, enrollment and the number of high school graduates move in different directions.

There may be some temporal lag by which the number of graduates impacts enrollment in the UW System, so the correlation coefficient is recalculated using year lags of the high school graduates data. The measure at T-1 equals -0.03, at T-2 equals 0.09, at T-3 equals 0.11, at T-4 and T-5 equal 0.12, and at T-6 equals 0.10. In other words, there is initially a weak negative relationship between the number of graduates and enrollment. Years 1 through 6 exhibit a relationship that is weakly positive with the positive effect peaking in year 5.

Conclusions

UW System enrollment and enrollment at all physical UW-Colleges has declined over the period from 2010-2017. Meanwhile, 7 out of 13 Universities have experienced growth in enrollment during the same period. Relatively speaking, the preliminary enrollment data indicate the conditions at the UW Colleges have significantly deteriorated with the merging of the UW College with the Universities. Nevertheless, enrollment in the UW System continues to exceed levels seen as recently as 2006.

There is notably a weak degree of positive correlation between the unemployment rate and enrollment in the UW System. However, the large degree of heterogeneity among correlation coefficients across the Universities tends to suggest there are many other factors at play. Also, the number of high school graduates and enrollment in the UW System, unexpectedly, move in opposite directions in the short-run. After some time, producing fewer high school graduates leads to declining enrollment in the System.

In sum, while things such as historically low unemployment rates and generational shifts in demographics may determine enrollment levels, it is not only possible but rather probable that students are responding to uncertainty and choosing to attend more stable institutions of higher education, both in-state as well as out.

If you like the work we are doing, then consider becoming a partner. Please contact us here.

The Central Wisconsin Economy